Game launches, side by side
Comparing game launches took analysts at major publishers about 20 minutes by hand, and our main competitor did it for them. I spotted the gap, made the case for fixing it and designed a one-click solution that lifted our UMUX efficiency score from 71 to 86.
A churn risk hiding in a workflow
Newzoo sells games market data to publishers like Riot Games and Xbox. Our main competitor, Data.ai, offered a feature we lacked: align games by release date. At the same time, our highest-value clients kept telling us their monthly reports took too long. I suspected the two were connected.
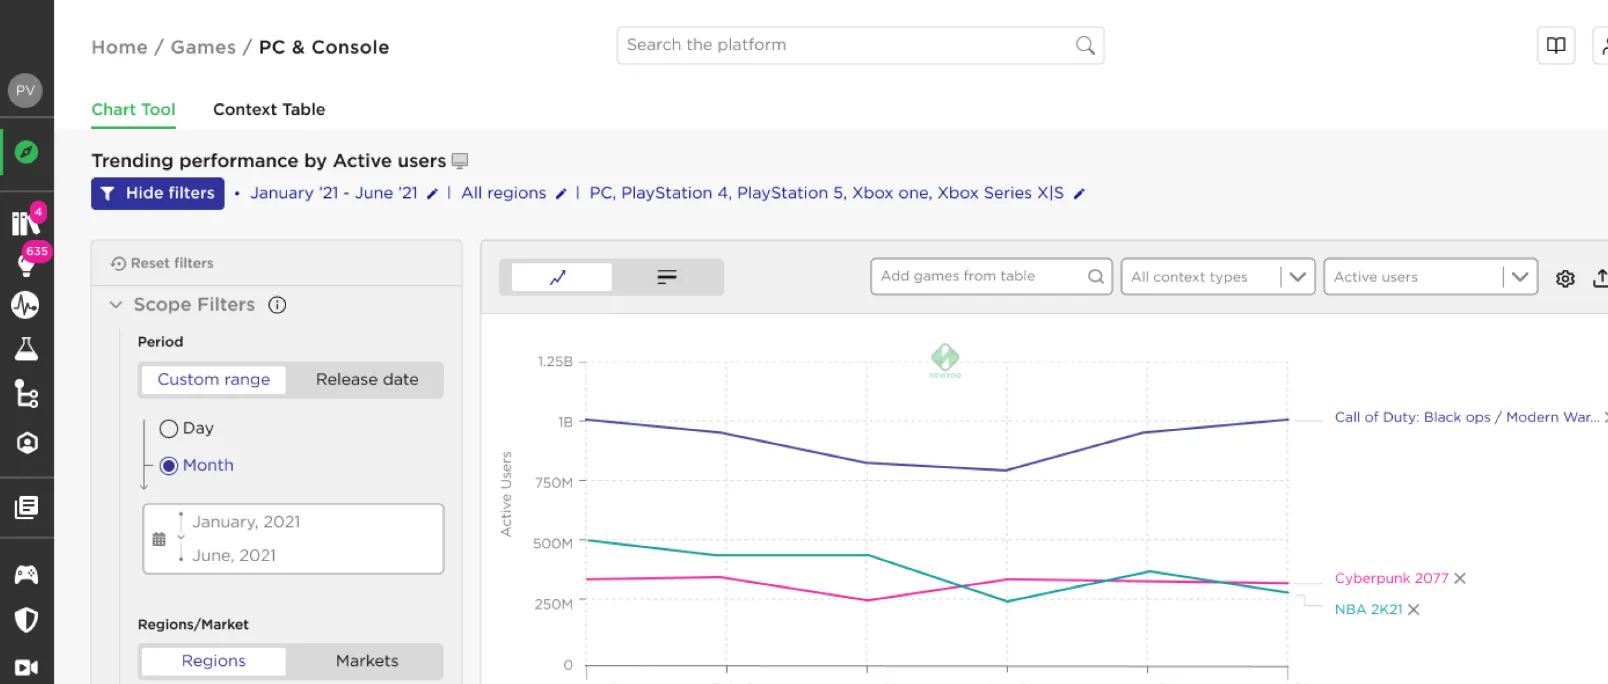
Comparing games since launch is one of an analyst's most common tasks. On our platform, it took a hunt across two pages and a spreadsheet.
Making the case with data
I didn't wait for a brief. I built the business case myself and framed it as a churn risk among high-value clients, which is what got product leadership to prioritise it.
It drew on three sources:
- UMUX survey. The overall score was a healthy 82, but efficiency lagged behind, and comments kept mentioning time-consuming reports and difficulty comparing titles.
- Amplitude. People doing this comparison had much longer sessions and many back-and-forth clicks between the profile and analysis pages. It wasn't an edge case.
- Competitor analysis. Data.ai already solved it, which made the gap urgent.
“Manual data extraction is a time sink. I have to open multiple tabs and switch between them many times so I can get a report, and I have to do this every month.”
UMUX survey comment, June 2022
The user pain was compelling, but the churn risk is what moved the roadmap. I was given the green light to lead discovery.
20 minutes for one comparison
To see the problem first-hand, I interviewed data analysts at publishers including Activision Blizzard, Riot Games and Square Enix.
In one session, an analyst from Riot Games shared their screen and walked me through their monthly report. Comparing two games since launch took nearly 20 minutes, with a workaround they had built themselves. The platform had the right data; the analyst was doing the work it should have done.
From grand vision to pragmatic value
My first idea was a full redesign of the PC & Console analysis journey, but an early talk with the engineering manager showed the team's capacity was committed to other priorities.
I chose a release-date toggle on the existing analysis page over a full redesign of the analysis journey.
WhyIt solved most of the problem with a fraction of the effort, so it shipped in a few sprints instead of waiting for a redesign.
With a front-end developer, I found what the existing interface could support: one toggle in the period filter. Switch to Release date and every game's line starts at its own launch, on one axis.
| Game | Month 0 | Month 1 | Month 2 | Month 3 | Month 4 | Month 5 |
|---|---|---|---|---|---|---|
| Call of Duty: Black Ops Cold War (released 2020-11) | 12.4M | 25.6M | 27.2M | 25.9M | 25.1M | 22M |
| FIFA 21 (released 2020-10) | 10.1M | 10.3M | 11.6M | 11.5M | 11.3M | 11.2M |
| Call of Duty: Vanguard (released 2021-11) | 15.6M | 14.7M | 10.5M | 8.3M | 7.6M | 9.1M |
Release date only shows games released after April 2020, so the filter says so in a note right under the toggle, instead of silently dropping older games.
Impact
After launch, I re-sent the UMUX survey to the same cohort of power users.
Closing the gap with Data.ai removed a point of friction for our highest-value clients, and with it a reason to churn.
What I learned
Speak the language of the business
User pain made the problem real, but the churn risk got it prioritised. I learned to frame design problems as business problems.
Constraints focus the work
Limited capacity pushed me from the ideal redesign to the simplest change with the most value.
Measure the user's goal, not the click
Clicks showed discovery. Time to create a report would have shown the real value, and next time I'd define that metric before launch.